
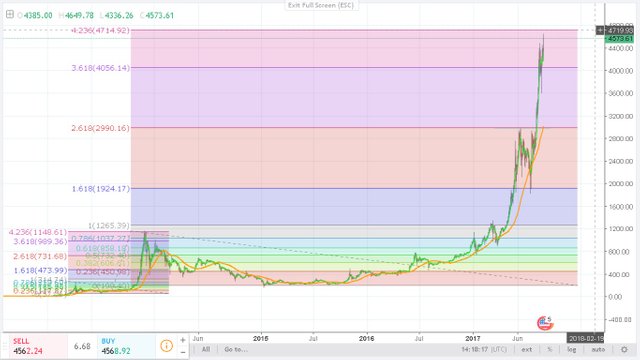
This is daily chart and it shows the previous Bitcoin bubble and the current one !
These Fib lines are based on the previous wave in 2013, And if this is correct ... Bitcoin won't pass 4715 $ utill it crash again .
However .. It's almost impossible to predict in this market , But everybody does his TA
Even if this wasn't the top .. Bitcoin must correct its price because it's way far from MA, Be careful ! Good luck for all
damn
Downvoting a post can decrease pending rewards and make it less visible. Common reasons:
Submit
It´s not a stock, it´s not a classical asset, it´s deflational, the market is extremly dynamic. All reasons that classical chart analysis can fail here. Have the previous movements been predicted by TA? Any?
Downvoting a post can decrease pending rewards and make it less visible. Common reasons:
Submit
Well i saw people were shouting out " Bitcoin bubble " Since it reached 2950 $ because it was overbought, And that was real and it crashed to 1800 $ , But it went for another ATH and it's overbought again but no one knows what the next bottom is , Thanks for sharing your thoughts .
Downvoting a post can decrease pending rewards and make it less visible. Common reasons:
Submit