You first need a reference point. Assume the Bitcoin price on March 26, 2025, is $88,000, based on recent market data (Bitcoin Price Daily Insights). Assign this reference price
𝑝
0
=
88
,
000
p
0
=88,000 a reference frequency
𝑓
0
=
440
f
0
=440 Hz, a standard pitch for concert A. For any current price 𝑝
p, the corresponding frequency is
𝑓
=
𝑓
0
×
𝑝
𝑝
0
f=f
0
×
p
0
p
.
For example, if the price rises to
𝑝
=
93
,
200
p=93,200, the frequency ratio is
93
,
200
88
,
000
≈
1.0591
88,000
93,200
≈1.0591, and the new frequency is
440
×
1.0591
≈
466.1
440×1.0591≈466.1 Hz.
Calculating Cent Intervals for Price Changes
The cent interval between two prices
𝑝
1
p
1
and
𝑝
2
p
2
is calculated as
cents
=
1200
×
log
2
(
𝑝
2
𝑝
1
)
cents=1200×log
2
(
p
1
p
2
). Let's compute for the example above:
𝑝
2
𝑝
1
=
1.0591
p
1
p
2
=1.0591
log
2
(
1.0591
)
≈
0.0833
log
2
(1.0591)≈0.0833 (using the change of base formula,
log
2
(
𝑥
)
=
ln
(
𝑥
)
ln
(
2
)
log
2
(x)=
ln(2)
ln(x)
, and
ln
(
2
)
≈
0.693
ln(2)≈0.693)
Cents =
1200
×
0.0833
≈
100
1200×0.0833≈100
This result, 100 cents, corresponds to a semitone, meaning the price increase from $88,000 to $93,200 is musically a semitone, which aligns with a price ratio of approximately 1.05946 for 100 cents, confirming our calculation.
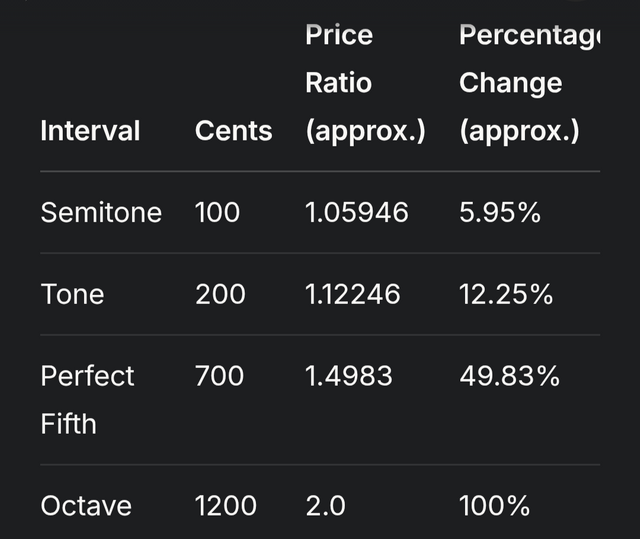
To understand what different cent intervals mean in terms of price, consider the following table of common musical intervals and their corresponding price ratios:

This table shows that a 100-cent increase (semitone) is about a 5.95% price rise, while a 700-cent increase (perfect fifth) is nearly 50%, providing a way to quantify price movements in musical terms.
Identifying Patterns for Speculation
Once you calculate cent intervals for historical Bitcoin prices, you can look for patterns that resemble musical scales or sequences. For instance, if daily price changes often show intervals of 100 cents (semitones) or 200 cents (tones), you might hypothesize a market trend of incremental, stepwise increases. This is akin to technical analysis in finance, where traders look for chart patterns, but here, you're using musical intervals.
For example, suppose over a week, the cent intervals are 100, -50, 200, 100, -150. This sequence could be analyzed as a melody, and if it resembles a known scale (e.g., major scale: tone, tone, semitone, tone, tone, tone, semitone), you might predict the next movement based on the scale's pattern. However, this is highly speculative and not supported by standard financial theory.
Using Consonant and Dissonant Intervals
Music theory distinguishes between consonant intervals (stable, like perfect unisons, octaves, fifths, major thirds) and dissonant intervals (unstable, like seconds, sevenths). You could interpret price movements corresponding to consonant intervals as indicating market stability and dissonant intervals as volatility. For instance, a 700-cent increase (perfect fifth, consonant) might suggest a stable upward trend, while a 200-cent increase (tone, potentially dissonant in context) might indicate tension, expecting resolution.
This approach is metaphorical and experimental, with no empirical evidence from financial markets to support it, but it could offer a creative lens for speculation.
Practical Steps for Implementation
To implement this in Bitcoin speculation:
Collect historical Bitcoin price data, such as daily closing prices, from sources like CoinGecko Cryptocurrency Prices.
Choose a reference price (e.g., $88,000 on March 26, 2025) and frequency (e.g., 440 Hz).
Calculate cent intervals for consecutive prices using the formula.
Plot these intervals and look for patterns, such as repeated semitones or sequences resembling musical scales.
Use identified patterns to hypothesize future price movements, setting targets based on musical intervals (e.g., next price at a perfect fifth, 700 cents, ~50% increase).
For example, if the price is $88,000 and you expect a semitone increase, target $93,200 (100 cents, ~5.95% up). For a perfect fifth, target $131,904 (700 cents, ~49.83% up).
Limitations and Considerations
This method is experimental and not a standard in financial analysis. It's akin to using percentage changes, as cents are proportional to logarithmic returns, which are common in finance. The predictive power is uncertain, and you should combine it with traditional methods like technical analysis or fundamental analysis. Additionally, market psychology and external factors (e.g., regulatory news, macroeconomic trends) heavily influence Bitcoin, which this approach may not capture.
Unexpected Insights: Artistic Analysis
An unexpected insight is treating Bitcoin price movements as a musical composition, where you analyze the "melody" of cent intervals for aesthetic patterns. This could appeal to traders who enjoy creative approaches, though it's more artistic than scientific, and its utility in speculation is unproven.
Conclusion
Using cents from music theory in Bitcoin speculation involves mapping price changes to musical intervals, calculating cent differences, and looking for patterns to predict future movements. While creative and potentially insightful, it's experimental and should be used cautiously, ideally alongside established financial methods. This approach offers a unique perspective, bridging art and finance, but its effectiveness remains to be validated through further study.