.png)
Good day, and welcome to another episode of the steemit crypto academy homework. It's been a great ride from day 1 and the ride is still in progress. I'm glad to participate in this week's homework delivered by professor @fredquantum. It's all about the on-balance volume indicator (OBV). Let's see how far I've gone with learning from what the prof taught in his wonderful presentation.


If the closing price of an asset today is higher than yesterday's closing price, the volume of both days would be added and the total would be regarded as today's obv.
Also, if the closing price of today is lower than the previous day, we are going to subtract today's closing price from the previous days closing price and whatever we get is today's obv.
And finally, if yesterday's closing price is the same as today's, then there will be neither addition nor subtraction. The same value would be the obv for that day.


.png)
.png)
We can see the obv indicator line in the image above.
The first thing is to login to binance and select a trading pair. As displayed in the image below, click on the indicator sign, serach obv and click on it. The indicator would reflect below the chart in the pane.
.png)
.png)
Here, we have the image showing the obv indicator


To calculate the OBV, let's first understand that we have
The obv is the resent or the present value of the obv
The previous obv which is the value from the previous day obv
So, to calculate the OBV, we would have to look at it from three perspectives
From the angle where the closing price of an asset today is higher than yesterdays closing price
When today's closing price is lower than the previous days closing price
When the days closing price and the previous day closing price tally (are the same)
If the closing price of an asset today is higher than yesterdays closing price, the formula would be
OBV = current volume + previous volume. This is the obv for that day
If today's closing price is lower than the previous days closing price, the formula would be
OBV = current volume - previous volume
Lastly, if the days closing price and the previous day closing price tally (are the same), here is the formula below
OBV = current volume - previous volume
First day closing price = $5, volume = 500,000
Second day closing price = $6, volume equals 528,590
Third day closing price = $5.87, volume equals 510,250
forth day closing price = $6.05, volume equals 600,454
Fifth day closing price = $6.05, volume equals 600,300
The obv calculation goes thus
day obv = 0
seconday obv = 0 + 528,590 = 528,580
Third day obv = 528,590 - 510,250 = 18,340
Fourth day obv = 600,454 + 18,340 = 618,794
Fifth day obv = 618,794


.png)
.png)


.png)
.png)


.png)
From the image above, we can see that the previous high on the chart and the obv high are at the same level, but if we look further, we would see a slight difference. Every other candle built was unable to surpass the previous high until there is a breakout. So this breakout is the advanced breakout represented on the chart, and this is called the advanced bullish breakout.
.png)
Just like what happened in the bullish advanced breakout, the opposite is what we see in the above chart. the price could not break the previous low as we can see the markings on the chart until we have the advanced bearish breakout.


BULLISH DIVERGENCE WITH ON-BALANCE INDICATOR
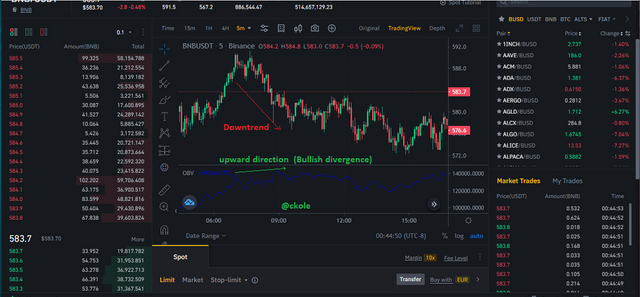
A bullish divergence occurs when the price of an asset on the chart starts moving downward but on the other hand, the obv indicator goes against the movement i.e going up instead. Most times when this happens, it's an indication that the price would move up and go bullish because the obv indicator has shown the next price action. What causes this to happen sometimes is when the bears are injecting into the market and the bears are weakened.
Divergence occurs when a stronger wind moves away from a weaker wind or when air streams move in opposite directions. When divergence occurs in the upper levels of the atmosphere it leads to rising air.
We can from this understand why divergence occurs between the chart and indicators. So in the case of the bullish divergence, the bulls start dominating and eventually separate themselves from the bears, which led to the rising in the price of the asset. The traders can use this measure to determine the next trend or price direction and go for a buy. No matter how long a divergence is, it would later be corrected and the price movement would move in the same direction with the indicator line

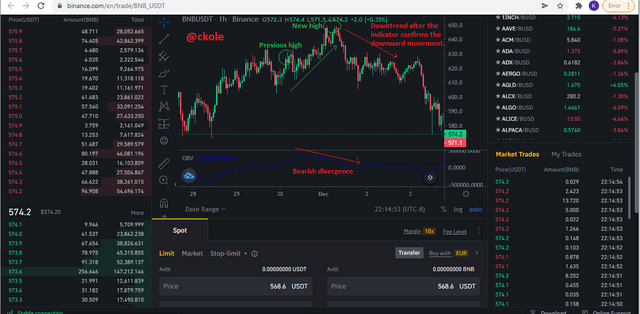
The image above shows the bearish divergence. When the price keeps moving up, the obv line moves in an opposite direction which portends the future movement of the asset price.

The bullish divergence speaks the opposite of the bearish divergence. When the price of the asset moves down, the obv line goes in the opposite direction.


Using obv trend confirmation, with the moving average, I placed two trades based on the direction of the price and the market volume. The first trade I placed was sell.
For sell
I discovered that the price of the asset starts decreasing because the traders have started selling which caused a decrease in volume. So the obv line moves in a bearish direction and the other indicator used (moving average) confirms the bearish movement as the lines remain above the price without showing any sign of crossing over. And besides, the price made multiple lower low as it comes down, and I used a 1:1 reward ratio to minimize huge loss in case of a bad day trade. Here is an image below
.png)
.png)
For Buy
Still using the trend confirmation for the buy order using the obv indicator accompanied with the moving average. The price of the asset has made multiple higher highs and the trend keeps going up, so I followed it using a 1:1 reward ratio. The obv indicator shows a bullish movement and the moving average remains below the price showing a bullish movement. See the images below.
.png)
.png)


The obv is a good indicator that can be used for predicting the price movement of an asset in both ways either up or downtrend
It gives the trader an insight on when and when not to enter a trade. When the market is ranging, trending, or retrenching, traders can wait and read the volume of the asset injected into the market and the direction of movement of the obv line to determine when to place a trade
The obv is good for identifying breakout and divergence. Bullish and bearish divergence really occur, so when this is spot, it's an advantage for the trader. Obv is good at spotting bullish and bearish divergence and also knowing when the price is breaking out in either direction.
Every indicator has the good and the ugly side. In the case of obv, it has a leading reading, which makes it a leading indicator and if not properly analyzed, can give a trader a false signal. That's why it's always advisable to use it with a lagging indicator like a simple moving average.
It's said that without any volume ascribed to an asset, there can never be a price movement. This makes the obv indicator very unique because it's built around the volume. Technical indicator tools are there to guide the traders. We can use them to predict the price movement and spot fake signals. The obv indicator works well but can be used with other technical indicators for more accuracy because using only one indicator might not be perfect enough to give us the right signal. Also, when we use these indicators, we must understand that they are not 100% perfect because of the market volatility, however effective, so we should always remember to manage risks.
Thanks for reading, and a big thank you to the prof @fredquantum for the wonderful lectures and the homework. Gracias.
This is ckole the laughing gas.
One love.