Yesterday I go through the lecture taught by our respected professor @reddileep which is all about Advanced Technical Analysis Using Fractals and here is my homework post in this regard, so let's begin with it without wasting much time;
.jpg)

1. Define Fractals in your own words.

Fractals
Cryptocurrency and other financial market prices are difficult to anticipate and random, yet they always produce repeating patterns and trends. Fractal patterns are one of numerous patterns that can be used to assess trends. Simply defined, it is to identify a reversal signal, which is a simple fractal pattern made up of 5 candles. This is what encourages traders to perform analysis in order to determine the trend.
If we can grasp the structure of the fractal, we will be able to determine which wave to catch on which time axis, making it clear what to wait for and increasing the accuracy of the entry. It also indicates where to place the stop-loss line and where to take profit, minimising uncertainty regarding the transaction.
We can employ bearish and bullish fractal patterns in candlestick charts. However, we must agree that identifying fractal patterns on our own is really tough, so we may utilise fractal indicators to find these patterns. There are numerous indicators that can be employed, one of which is the Williams Fractal.
We should wait for the fifth candle to close before making any trading decisions because the default fractal is a five candle formation (more than 5 is fine, no fewer). This is because the price may fluctuate during the creation of the fifth candlestick. The fractal indicator will disappear from the price chart if the price rises above the higher high or falls below the lower low. As a result, we must wait for the fractal formation to be completed.

2. Explain major rules for identifying fractals. (Screenshots required)

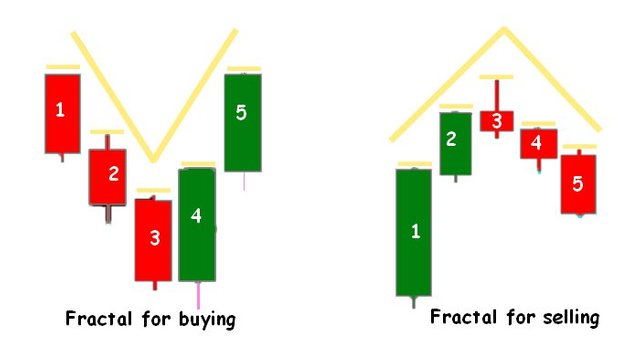
As I just described above, a fractal pattern must have 5 candles or more; if it has less than 4 candles, it is not a fractal. Then, if the 5 candles follow the structure or match the fractal conditions, we can detect fractal patterns.
Bullish Fractals
When there are 5 or more candles with specified qualities, the middle candle must close lower than the other two candles on its side to make a bullish Fractal pattern. In other words, the middle candle must be the lowest low, while the two candles on either side represent the higher low. Take a look at the illustration below. The chart below shows a clear illustration of a bullish Fractal formation. The opening price of the middle candle is lower than the opening prices of the two candles on either side.
Bearish Fractals
The market will form a Bearish Fractal pattern if there are 5 candles with different characteristics, and the middle candle must close higher than the other two candles on its side. To put it another way, the centre candle must have a greater high while the two side candles must have a lower high. The chart below clearly depicts a bearish Fractal formation. The middle candle's opening price is higher than the opening prices of the two candles on either side.

3. What are the different Indicators that we can use for identifying Fractals easily? (Screenshots required)

There are numerous fractal-based indicators that can be employed; thus, I will discuss some of the most commonly used fractal indicators in this post.
Williams Fractals
When we look at the chart above, we can see the arrows on this indicator. To avoid complications, these arrows have been coloured red and green for bullish and bearish fractals, respectively. As I mentioned earlier, the fractal trading approach incorporates trend reversals, and by using these arrows, we can see the possibility of small reversals on a higher timeframe and larger reversals on a lower timeframe. As the basis for fractal analysis, the Williams Fractal Indicator can help with trend reversal identification. The green arrows represent Buy signals, while the red arrows represent Sell signals. As a result, each red arrow point represents a specific downward move, and the opposite is the case for the green arrows.
This is not as simple as it appears since the usage of this indicator must be combined with other indicators to filter the signals generated so that we are not trapped by misleading signals generated by Williams Fractals.
To complement entry, we can utilize fractals using Fibonacci retracement levels. Using Fibonacci retracement levels will help us determine which fractal to trade and at which Fibonacci level to enter. As a result, trades will be based on Fibonacci levels, but this should also be determined by the trader. A trader can set a standard that an entry should be taken until a fractal reverses to a given Fibonacci level, but this will rely on the level that has worked for the trader over the years.
Another fractal trading approach used by traders is to switch from lower to higher time frames to reduce the amount of fractals on the chart and focus on "genuine" fractals worth trading on. The system generates good entries based on such criteria, and the rest of the work, such as risk management, is left to the trader.
Fractal Support And Resistance
Let us now discuss fractal support and resistance, as well as the fractal breakout method. We know that support is a price level at which a declining asset's price is likely to pause and then rebound in a bullish trend. Resistance, on the other hand, is the point at which an asset's rising price is predicted to pause and return to a bearish trend. The same idea underpins fractal support and resistance, which are illustrated by red and green lines. Support is shown by red lines, while resistance is illustrated by green lines.

The Fractal Breakout strategy is based on the idea that if the fractal resistance is broken, the price is likely to move higher, and a trader can materialise a signal by taking a buy position. If, on the other hand, fractal support is broken, the price is predicted to fall and this can be accomplished by taking a sell position. I identified bearish and bullish breakouts in the chart below, and it can be observed that price action is obeying these levels as specified.


4. Graphically explore Fractals through charts. (Screenshots required)

Since there are many entries on the green and red arrows, using the above indicators to detect fractals is quite simple. In this section, I'll describe how we can identify an existing pattern that is about to repeat or is being replicated to some level. This cannot be exactly the same, but if it is exactly the same as the new trend in formation, then this is a fantastic opportunity for a trader.
This is accomplished by detecting a trend on the price chart that appears to be the current trend, tracing the previous trend with the use of a tool, and comparing it to the current trend forming. If a previous bull or bear run is set to repeat on the market, they will appear quite similar and provide traders utilizing such fractal analysis a head start edge as they become able to virtually correctly predict the market's next move.
To examine this activity on a chart, use the "Bars Pattern" option in trading view, then select the fractals from the chart and try to locate other patterns on the price action of the same chart elsewhere.
ATOMUSDT CHART

I chose a part of the small uptrend followed by a downtrend from the ATOM/USDT chart above. In the following section of the chart, I'll utilise the same fractal to see if it repeats. I copied and pasted the chart below and saw that the pattern is nearly similar. Please keep in mind that fractals are not limited to 5 bars. However, the concept of fractals is applied, but more data has been considered.

BTCUSDT CHART

In the above BTCUSDT chart I have selected a portion of trend to see it repeats again on this chart or not. I then copied and pasted that portion of chart to another part of chart and saw that the pattern is almost similar to the first one. Consider the screenshot below to understand this example;


5. Do a better Technical Analysis identifying Fractals and make a real purchase of a coin at a suitable entry point. Then sell that purchased coin before the next resistance line. Here you can use any other suitable indicator to find the correct entry point in addition to the fractal. (Usually, You should demonstrate all the relevant details including entry point, exit point, resistance lines, support lines or any other trading pattern)

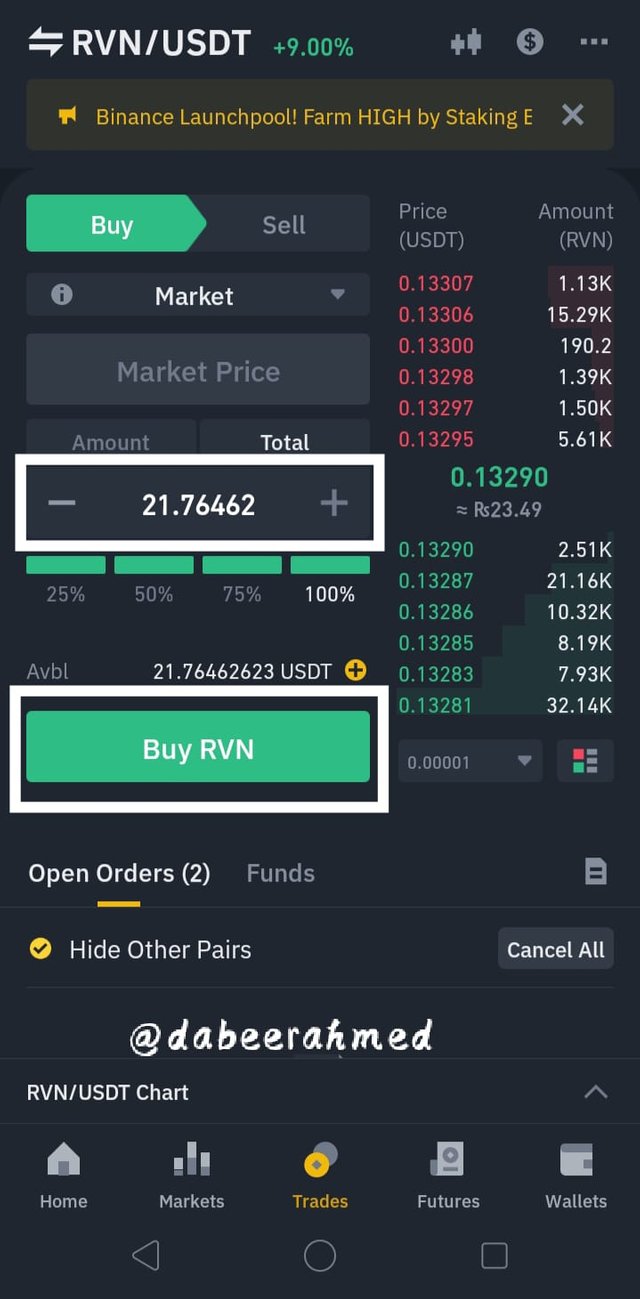
I'll be using the Binance platform to make live trades. I'll go with RVN/USDT since, after analysing the token, I see an appropriate entry point. I'll include some graphs below for further information.
Note : Market is not in condition of buying or selling, do your own analysis. This trade is also an extremely risky trade which also depends upon the market condition
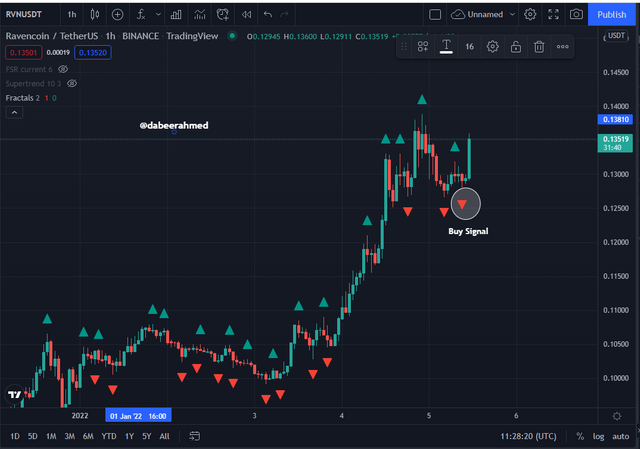
When I added the Williams Fractals o the chart, I have an entry point from which I may place a buy order. The Fractal indicator indicates it with a red arrow, indicating an uptrend, which can be used as a signal to enter the market.
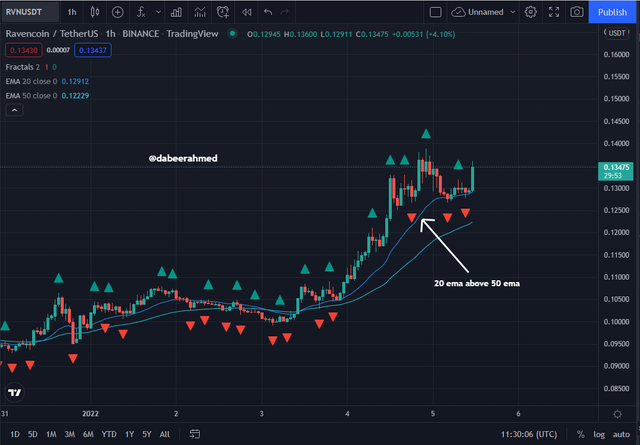
To be even more convincing and to filter out misleading signal, I combined the Williams Fractals with the EMAs of 20 and 50; here, the EMA 20 is above the EMA 50, indicating a bullish trend.
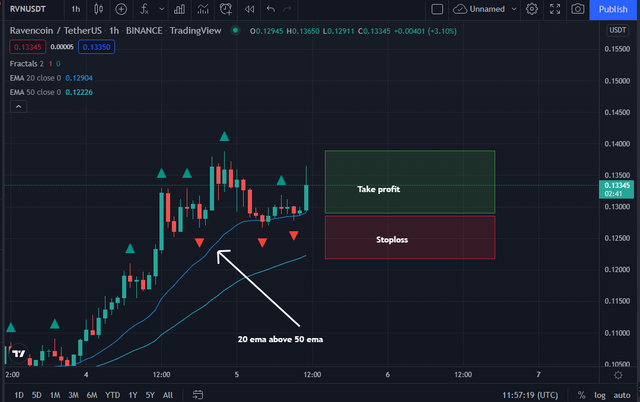
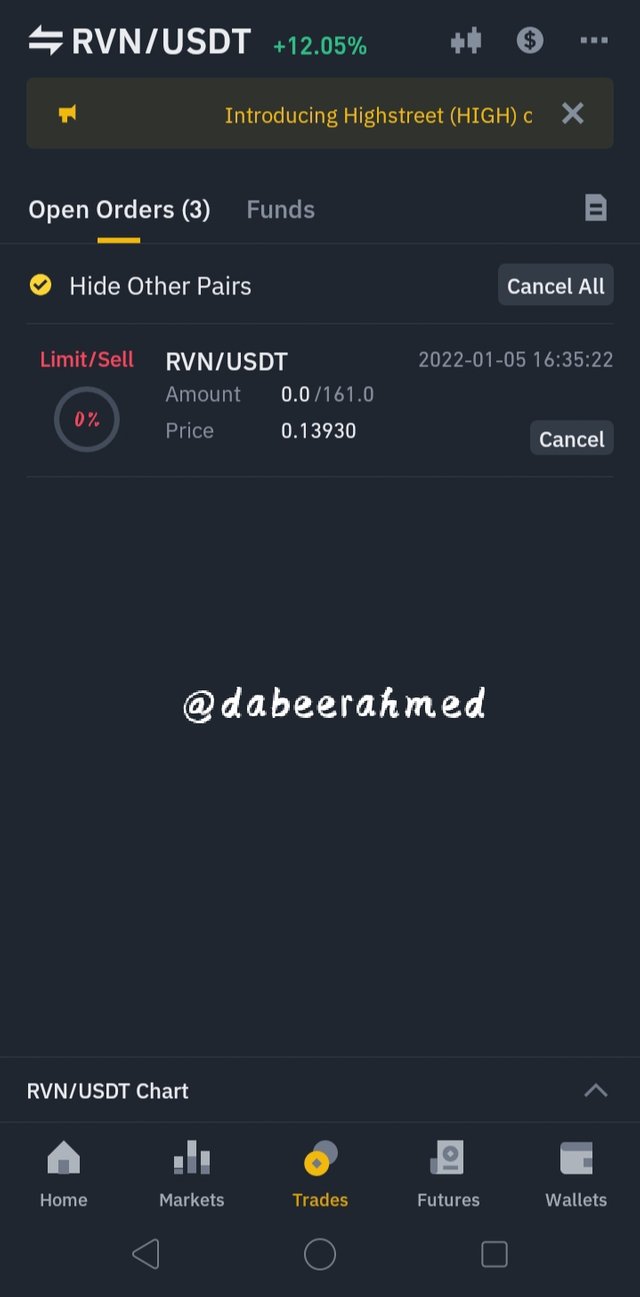
My entry point was $0.133, and after making a purchase, I immediately placed a sell order at $0.1393, which is just below the resistance level (previous higher high). Then I set my stop loss at $0.121, which is just below the dynamic support level offered by the 50 EMA.
Below are the screenshots of my real trade

Conclusion

We can utilize fractal patterns to identify reversals, but it's not as simple as we believe because these patterns don't always operate effectively. Finding Fractal patterns on the chart on our own can be tough, which is why we can utilise certain particular Fractal indicators developed to find Fractals.
Williams Fractals are one of the most often used Fractal indicators. This indicator is commonly used by traders because to its ease of use and accuracy in generating reversal signals, although the author of the indicator recommends combining it with other indicators such as the alligator or EMA's and other indicators to filter signals.

Note : All the screenshots of charts are taken from Tradingview
Regards, @dabeerahmed
