.png)
1a) What is the meaning of the Japanese candlestick chart? (A screenshot of the original is required.)
b) Explain why the Japanese Candlestick chart is the most popular in the financial market in your own words.
c) Explain the difference between a bullish and a bearish candle. Explain its anatomy as well. (A screenshot of the original is required.)
.png)
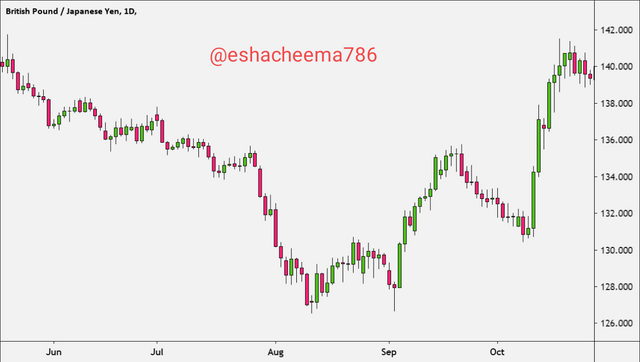
What is the meaning of the Japanese candlestick chart? (A screenshot of the original is required.)
Munehisa Homma, who lived in the 1700s, invented the Japanese candlestick chart. Munehisa Homma was a rice trader from Japan who wanted to know how the market reacted to the demand-supply relationship. He also wanted to see if it might lead to price modifications in the future. Candlestick charts are now utilised to trade Cryptocurrencies, Forex, Stocks, and a variety of other financial instruments.
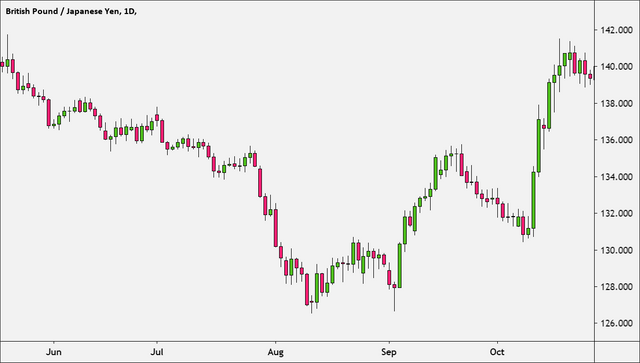
As can be seen in my chart above, bearish moves are usually represented by red candlesticks, while bullish moves are represented by green candlesticks.
The chart is used to determine asset prices at specific times in the past. The candlesticks simply symbolise the forces of supply and demand that are at action each time you open your chart.
• When demand outnumbers supply, prices rise as more traders enter the market to buy. The market is bullish at this point, and a green candlestick indicates that it will rise upwards.
• Prices, on the other hand, will fall if supply exceeds demand. In this market, there are more sellers. A red candlestick indicates that the price is moving downward.
All of these price movements are captured in a Japanese candlestick chart over various time periods. The chart can be used to forecast price changes in the future. The chart also contains patterns that aid traders in making trading decisions; it is an excellent tool for technical analysis, and it allows traders to determine who is in power of the market at any one time (be it the bulls or bears).
.png)
Explain why the Japanese Candlestick chart is the most popular in the financial markets in your own words.
In the financial markets, the Japanese candlestick chart is the most used. It provides a graphical picture of pricing changes over time that is extremely detailed and accurate. It's the main tool for price action trading and technical analysis because it transmits patterns. It is frequently used for a variety of reasons, including the following:
• Easy Identification of Market Patterns: Japanese candlestick charts show a lot of patterns that aren't visible on other charts or are very difficult to see. On a line graph, patterns like doji are tough to observe.
• Market direction: A Japanese candlestick chart makes it very easy to discern market direction. Candlestick shapes and colours aid traders in determining market direction. Uptrends, downtrends, upswings, and downswings, to name a few, are all plainly discernible.
• Spotting Price Motion: Candlestick colours and shapes aid in immediately identifying price action. You can quickly tell whether the bulls or bears have the upper hand. This aids in the decision-making process.
.png)
Explain the difference between a bullish and a bearish candle. Explain its anatomy as well. (A screenshot of the original is required.)
In a financial market, candlesticks are used to depict the exchanges between supply and demand. It depicts various price levels throughout time. Bullish and bearish candles are the two types of candles that exist.
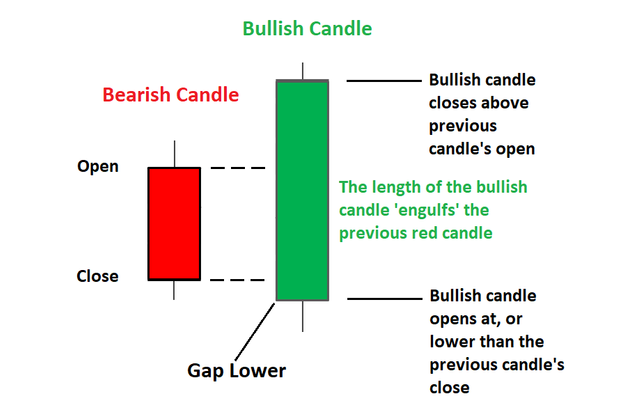
A bullish candle indicates that the price began lower and ended higher after a period of time. A bullish candle always closes higher than the previous candle, indicating a price increase, indicating that demand outnumbers supply and buyers are in charge.
A Bullish Candle's Anatomy
A bearish candle has four parts: high, open, close, and low.
• Open
This is the point at which the candle starts. It's also referred to as the starting price. A bullish candlestick always opens lower, indicating the start of market movement.
• Low
This is the lowest price that was achieved during the specified time period. The low of a bullish candlestick can be below or equal to the open price. When the low is lower than the open, it suggests that after the market opened, there was selling pressure that drove the price lower than the open. Then came the buying pressure, which sent the price back up.
• Close
After a certain amount of time, the candlestick will come to an end. The closing price is another name for it. Because of buying pressure, a bullish candlestick always closes higher than it opened.
• High
During the time period, this was the highest price. The high of a Bullish Candle can be higher than the close or the same price as the close. When the high is higher than the close, it indicates that there was buying pressure pushing prices higher than the open. Prices climbed, then fell due to selling pressure.
Bearish candel

A bearish candle is one that begins with a high price and ends with a lower price after a certain amount of time. A bearish candle always closes lower than the previous candle, indicating that supply exceeds demand and sellers (bears) have the upper hand.
A Bearish Candle's Anatomy
A bearish candle has four parts: high, open, close, and low.
• Open
This is the point at which the candle starts. It's also referred to as the starting price. A bearish candlestick always opens higher, indicating the start of price action.
• High
During the time period, this was the highest price. The high of a Bearish Candle can be above or equal to the open. When the high is higher than the open, it indicates that there was purchasing pressure that drove prices higher than the open. Prices climbed, then fell due to selling pressure.
• Close
After a length of time, this signifies the end of the candlestick. It's sometimes referred to as the closing price. Due to selling pressure, a bearish candlestick always closes lower than it opened.
• Low
This is the lowest price that was achieved during the specified time period. The bottom of a bearish candlestick can be below or equal to the close. When the low is lower than the close, it indicates that the market opened with selling pressure, causing the price to fall. Then came the buying pressure, which sent the price back up.
.png)
I'm grateful for the opportunity to learn about candlestick patterns. They are, without a doubt, the cornerstone for comprehending technical analysis.
Thank you for taking the time to read....
Cc :
Professor:
@reminiscence01
@awesononso
@nane15
@dilchamo


.jpeg)
