The Bitcoin market has undergone its second major correction since it broke through the all-time high of $20,000. This week, we will review the market and on-chain indicators to analyze the data related to this callback.
Bitcoin market overview
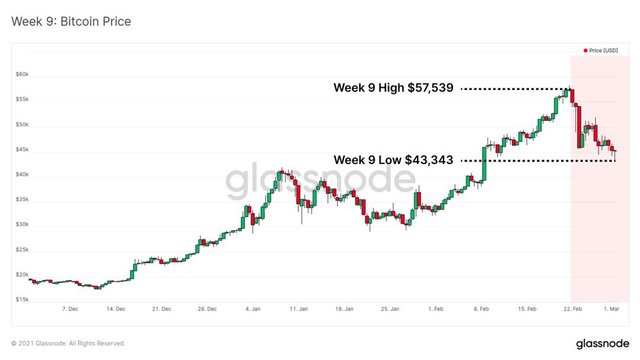
This week, the Bitcoin market began its second significant correction after breaking through an all-time high of $20,000. At the opening of this week, the price high was $57,539, and then it tended to an intraday low of $43,343, a correction of 25% .
Prices in many markets have become turbulent this week, mainly due to the rapid increase in the yield of the US 10-year Treasury bond. Given that Bitcoin is increasingly adopted as an institutional-level macro asset, it is not surprising that rapid changes in the time cost of funds will affect Bitcoin's pricing. The broader market narrative continues to evolve around expectations of inflation and deflation and the central bank’s policy response. Bitcoin may continue to play a key role in these discussions between institutions and investors.
The pullback leads to changes in the market
Major market corrections are positive events because they dilute speculation, leverage, and test the beliefs of holders. As the market seeks to set a new price bottom line, we have seen many market indicators reset, including open interest on futures, interest rate on futures funds, and gray-scale GBTC products.
This week's open interest in futures dropped by nearly 4 billion yuan from the peak of 18.4 billion yuan, a decline of 21.7%.
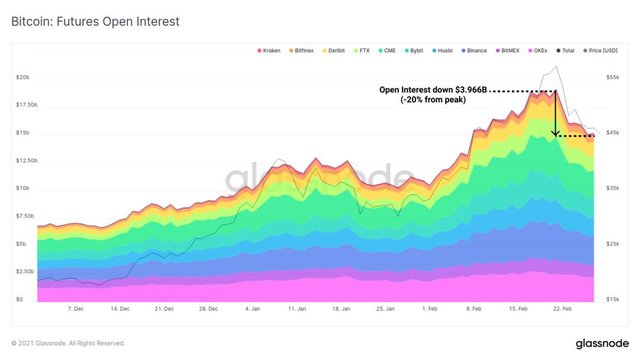
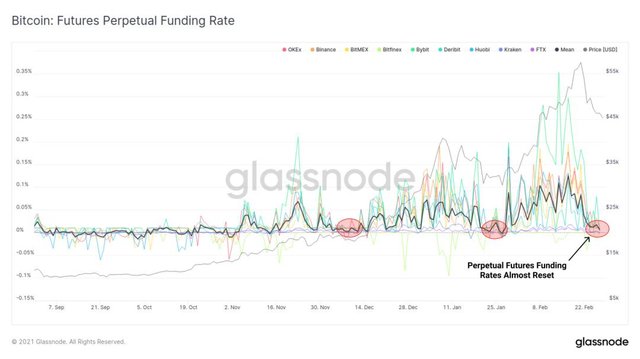
The interest rate of perpetual futures funds has also been reset to close to zero. The previous drop in open interest rates and the reset of funding rates indicate that there has been a wave of speculative trading. This increases the possibility of volatility in the spot market. However, it should be noted that the interest on open positions is still high, hovering around US$2.5 billion higher than the previous peak. There is still a significant leverage effect in the market.
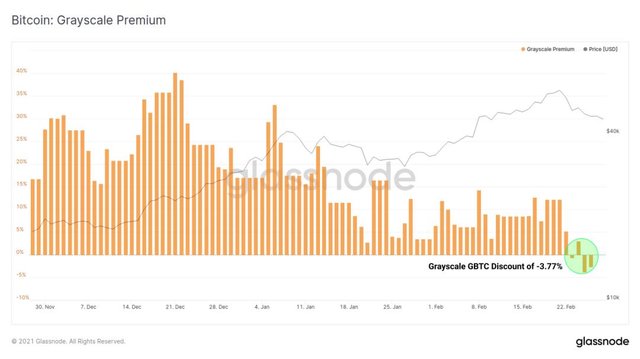
The gray-scale "premium" became the gray-scale "discount" for the first time, and the lowest fell to -3.77%. Although this price adjustment is a key driving force, the market is also beginning to see the launch of competitors' ETF-style products, such as Canada's Purpose ETF.
As more institutional BTC products enter the market, and with more options for institutional investment to make up for the arbitrage gap, future grayscale products (and other products) may not receive such a high premium.
On-chain indicators cool down
In addition to market dynamics, many of the on-chain indicators we track have also been reset or are cooling down during this adjustment.
The adjusted spending-output profit rate (aSOPR) was reset below 1.0 for the first time in this bull market, reaching a value of 0.988. The aSOPR indicator looks at all the currencies spent on the day, and calculates their profit and loss from the last transfer.
When aSOPR is less than 1.0, it means that in general, the coins transferred on the day are losing money . A low aSOPR value, especially when the reset is below 1.0, also means that fewer old coins and profitable coins are spent. This shows that for long-term holders, confidence and holding strength still exist .
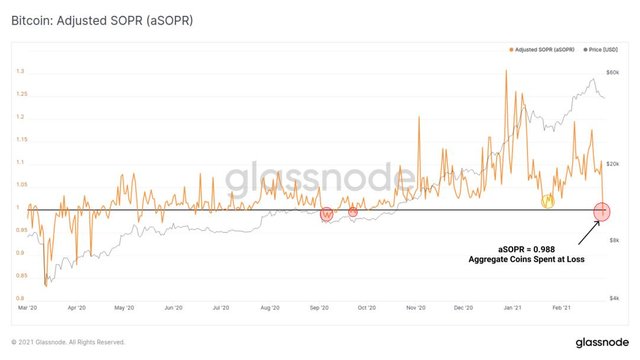
There are rumors and data that indicate that there has been an influx of new retail investors in the market . Therefore, this relatively steep reset of aSOPR may be our first on-chain indicator, that is, "panic selling" by new entrants. The previous decline from $42,000 was never completely reset to 1.0 due to strong buying support.
Is it different this time?
In order to prove how strong this bull market is, the unrealized net profit and loss (NUPL) indicator has so far not reached the typical bull market support value of 0.5 . When entering the second half of the bull market, NUPL fluctuated sharply in previous cycles. When NUPL reaches 0.5, it is often used as a key buying drop level. At this level, the market is at a market value of 50% of the total profit.
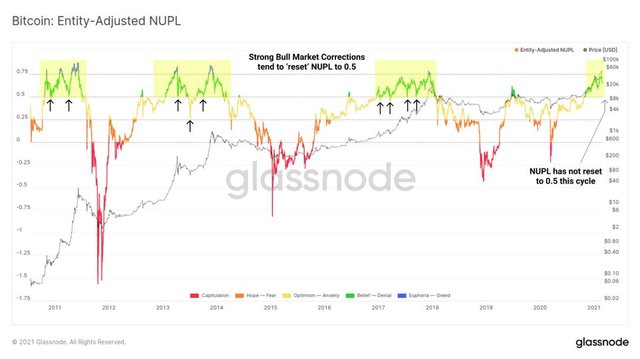
Although the two corrections in this cycle have caused iconic sideways and volatility, it seems that buyers have stepped in earlier, and there are fewer and fewer holders to sell in this cycle.
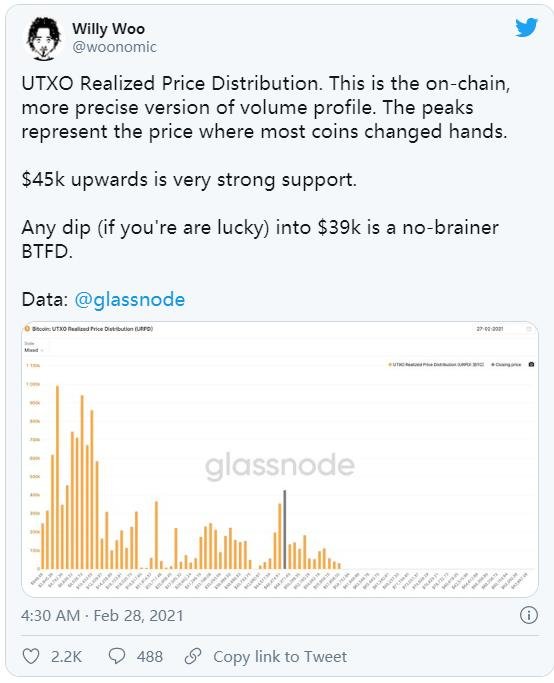
Willy Woo uses the realized price distribution to show where the potential bottom line of the price on the chain may exist. This indicator calculates the volume of transactions on the chain at different price levels. The goal is to find a price level that accumulates a large amount of transaction volume on the chain, so that it is more likely to be supported. Using this indicator, Willy identified the $45,000 area as a potential support level .
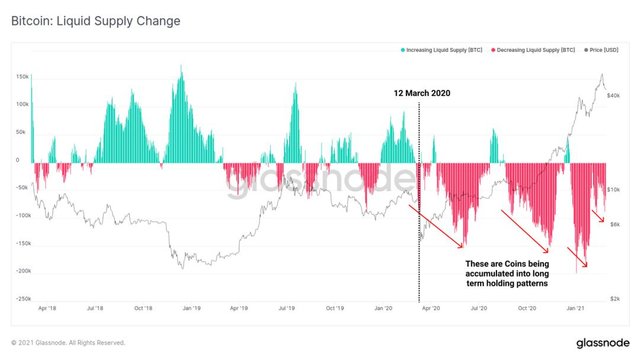
Perhaps this bull market is different, the continuing trend and the situation where more coins become illiquid are still continuing. The most important observation is the date this trend started: March 12, 2020 .
People's change of Bitcoin to a long-term holding model provides strong evidence for this trend, which shows that Bitcoin is now regarded as an important macro asset. Although the indicators on the chain are being reset, it can be said that there is still room for this correction, but the demand from long-term investors still seems to be great. Compared with the history of Bitcoin, this is quite unique in trend and scale, especially at this stage of the bull market .
Of course, the risk still exists, but this time may be different, maybe NUPL will really be reset to 0.5. In this case, since the realized price is traded at US$14,511, this means that a 50% profit level will correspond to the bottom line of 1.5*14,511=21,766 US dollars, which is quite large.
Weekly Topic: Uniswap's Liquidity
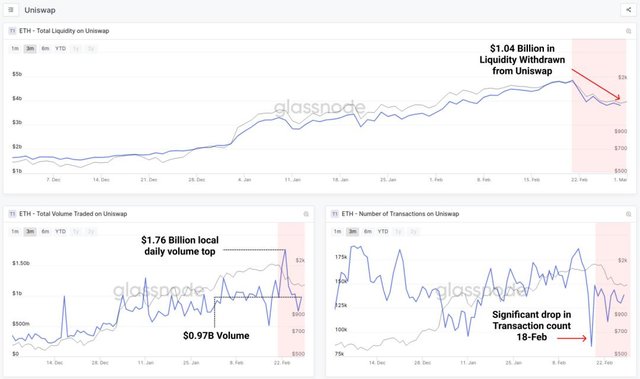
Last week we introduced the high gas fee environment of Ethereum and pointed out that this is not only a vote of confidence in the chain, but also a restriction on the users of the protocol. In the past week, Ethereum network fees have been lower than in recent months , and we have seen slight fluctuations in transaction volume and liquidity interacting with Uniswap. Maybe users take advantage of lower fees to reset their assets.
This week, US$1.04 billion in liquidity was withdrawn from Uniswap, and this liquidity appears to be distributed among various assets. On February 18, Uniswap's transaction volume dropped sharply from about 186,000 transactions/day to 85,000 transactions/day , which roughly marked the peak of the price of Ethereum. Subsequently, Uniswap transaction volume surged to US$1.76 billion on February 23, and fell 45% to US$970 million by the weekend.
Taking the four major DeFi assets as an example, we can see the liquidity withdrawal of Uniswap. The liquidity reserves of YFI, UNI, SUSHI and AAVE have all fallen by about 20% to 30% this week .
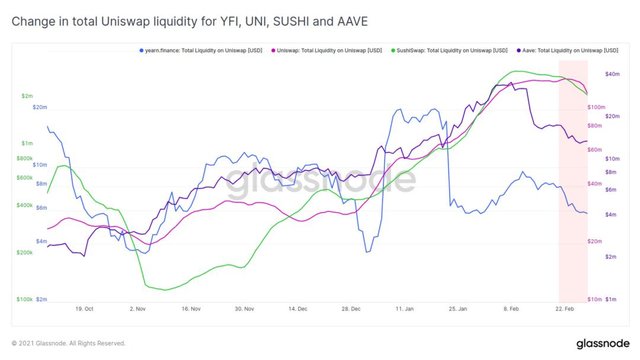
It must be pointed out that most of Uniswap's liquidity and trading volume values appear when they are close to historical highs , so whether these are just responses to price corrections or trend reversals remains to be seen.
To the question in your title, my Magic 8-Ball says:
Hi! I'm a bot, and this answer was posted automatically. Check this post out for more information.
Downvoting a post can decrease pending rewards and make it less visible. Common reasons:
Submit